Ohio State’s ‘A+’ COVID-19 data dashboard gets an upgrade
As universities become more sophisticated in how they respond to the pandemic, Ohio State University announced Monday it added additional features to its COVID-19 dashboard.
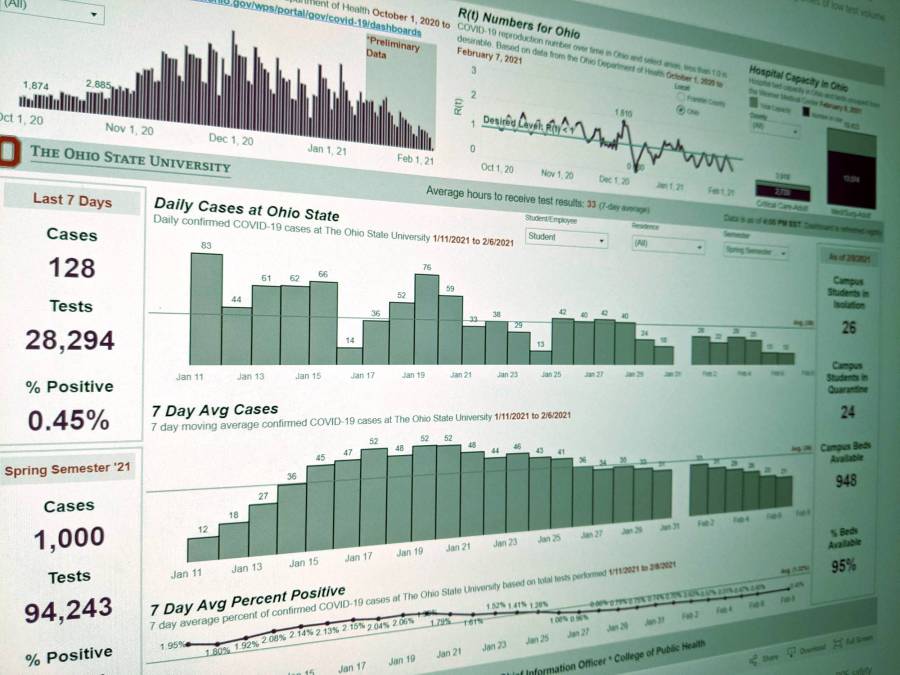
The dashboard, which gives users a view of how the coronavirus is spreading across Ohio, was tweaked to offer a better user experience, as well as the ability to look at data from as far back as the 2020 fall semester. Previously, users only had access to the most recent 20 days of COVID-19 testing data.
The dashboard combines data the university is collecting, as it offers testing for all students and employees, with statewide data, including daily cases and hospital capacity. Data on the dashboard includes a total number of tests, student positive results and student positivity rate over the most recent available 24-hour period. The dashboard also displays the cumulative results for faculty and staff.
With the addition of historical data beyond the most recent 20 days, users can spot trends in testing availability, as well as whether those tests are positive or negative.
“Users, for example, can still get to the various testing results by a single day, seven-day average and cumulative for both students and employees by using the available filters,” said Eric Mayberry, the director of data and analytics in the university’s CIO office. “New with this version, users can view information compared over a significantly longer period of time.”
That longer period of time goes back to the fall 2020 semester when the university began testing its asymptomatic students.
“The idea is to increase transparency by giving the campus community and the public additional data points as well as perspective on the prevalence of the virus at Ohio State,” Mayberry said. “It is important to see how the university community’s efforts to slow the spread have fared.”
The dashboard itself was recognized in September with an “A+” rating from We Rate Covid Dashboards, a website run by a team of professors and university technology leaders from across the country. Only three other universities — Wagner College, Johns Hopkins University and Amherst College — rank higher.
The dashboard is just one of Ohio State University’s efforts to combat COVID-19 and improve accessibility on campus. The university announced last month that it was working with Google on efforts to limit the spread of misinformation around COVID-19 vaccines. Last March, the university released a free suite of online tools and resources aimed at treating patients who are unable to speak, as well as an app to connect blind students with remote assistants who can read signs and describe visual surroundings.